rgManQQtest1
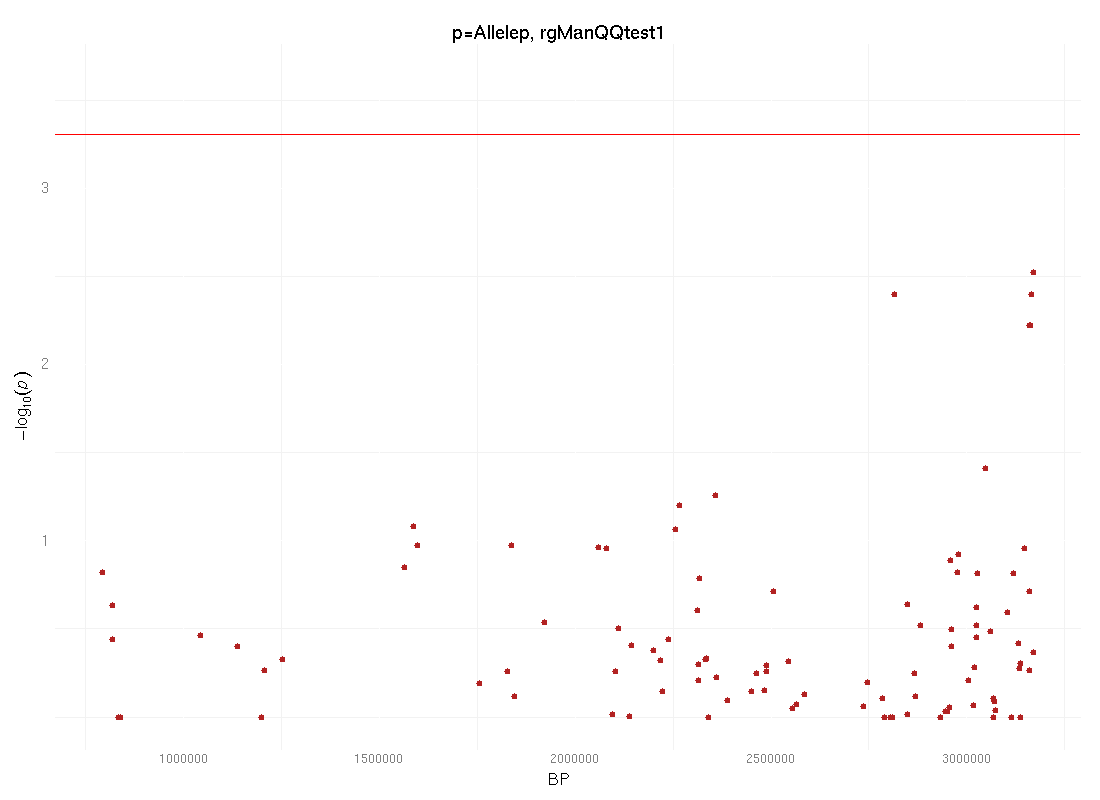 (Click to download image Allelep_manhattan.png) |
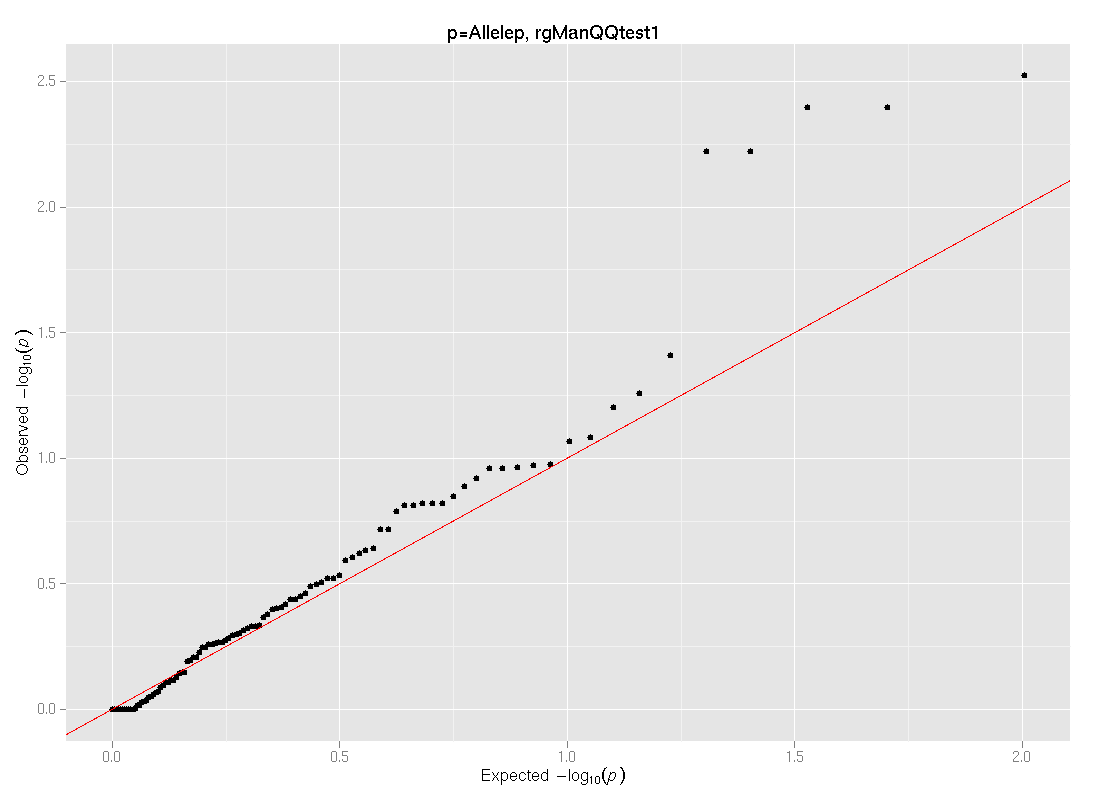 (Click to download image Allelep_qqplot.png) |
| rgManQQtest1.R |
| rgManQQtest1.R.log |
R log follows below
Loading required package: reshape

Loading required package: plyr


Attaching package: 'reshape'


The following object(s) are masked from 'package:plyr':


    round_any


Loading required package: grid

Loading required package: proto

[1] "### 101 values read from /tmp/rgManQQtempcWfFkc read - now running plots"

[1] "## qqplot on Allelep done"

[1] "## manhattan on Allelep starting 1 2 3"

[1] "## manhattan plot on Allelep done"

## R script=

# license not stated so I'm assuming LGPL is ok for my derived work?
# generalised so 3 core fields passed as parameters ross lazarus March 24 2010 for rgenetics
# Originally created as qqman with the following
# attribution:
#--------------
# Stephen Turner
# http://StephenTurner.us/
# http://GettingGeneticsDone.blogspot.com/

# Last updated: Tuesday, December 22, 2009
# R code for making manhattan plots and QQ plots from plink output files.
# With GWAS data this can take a lot of memory. Recommended for use on
# 64bit machines only, for now.

#

library(ggplot2)

coloursTouse = c('firebrick','darkblue','goldenrod','darkgreen')
# not too fugly but need a colour expert please...


manhattan = function(chrom=NULL,offset=NULL,pvals=NULL, title=NULL, max.y="max",
   suggestiveline=0, genomewide=T, size.x.labels=9, size.y.labels=10, annotate=F, SNPlist=NULL,grey=0) {

        if (annotate & is.null(SNPlist)) stop("You requested annotation but provided no SNPlist!")
        genomewideline=NULL # was genomewideline=-log10(5e-8)
        if (genomewide) { # use bonferroni since might be only a small region?
            genomewideline = -log10(0.05/length(pvals)) }
        d=data.frame(CHR=chrom,BP=offset,P=pvals)

        #limit to only chrs 1-23?
        d=d[d$CHR %in% 1:23, ]

        if ("CHR" %in% names(d) & "BP" %in% names(d) & "P" %in% names(d) ) {
                d=na.omit(d)
                d=d[d$P>0 & d$P<=1, ]
                d$logp = -log10(d$P)

                d$pos=NA
                ticks=NULL
                lastbase=0
                chrlist = unique(d$CHR)
                nchr = length(chrlist) # may be any number?
                if (nchr >= 2) {
                for (x in c(1:nchr)) {
                        i = chrlist[x] # need the chrom number - may not == index
                        if (x == 1) { # first time
                                d[d$CHR==i, ]$pos=d[d$CHR==i, ]$BP
                                tks = d[d$CHR==i, ]$pos[floor(length(d[d$CHR==i, ]$pos)/2)+1]
                        }       else {
                                lastchr = chrlist[x-1] # previous whatever the list
                                lastbase=lastbase+tail(subset(d,CHR==lastchr)$BP, 1)
                                d[d$CHR==i, ]$pos=d[d$CHR==i, ]$BP+lastbase
                                tks=c(tks, d[d$CHR==i, ]$pos[floor(length(d[d$CHR==i, ]$pos)/2)+1])
                        }
                    ticklim=c(min(d$pos),max(d$pos))
                    xlabs = chrlist
                    }
                } else { # nchr is 1
                   nticks = 10
                   last = max(offset)
                   first = min(offset)
                   tks = c()
                   t = (last-first)/nticks # units per tick
                   for (x in c(1:nticks)) tks = c(tks,round(x*t))
                   xlabs = tks
                   ticklim = c(first,last)
                } # else
                if (grey) {mycols=rep(c("gray10","gray60"),max(d$CHR))
                           } else {
                           mycols=rep(coloursTouse,max(d$CHR))
                           }

                if (max.y=="max") maxy=ceiling(max(d$logp)) else maxy=max.y
                maxy = max(maxy,1.1*genomewideline)
                # if (maxy<8) maxy=8
                # only makes sense if genome wide is assumed - we could have a fine mapping region?
                if (annotate) d.annotate=d[as.numeric(substr(d$SNP,3,100)) %in% SNPlist, ]
                if (nchr >= 2) {
                        manplot=qplot(pos,logp,data=d, ylab=expression(-log[10](italic(p))) , colour=factor(CHR))
                        manplot=manplot+scale_x_continuous(name="Chromosome", breaks=tks, labels=xlabs) }
                else {
                        manplot=qplot(BP,logp,data=d, ylab=expression(-log[10](italic(p))) , colour=factor(CHR))
                        manplot=manplot+scale_x_continuous("BP") }
                manplot=manplot+scale_y_continuous(limits=c(0,maxy), breaks=1:maxy, labels=1:maxy)
                manplot=manplot+scale_colour_manual(value=mycols)
                if (annotate) {  manplot=manplot + geom_point(data=d.annotate, colour=I("green3")) }
                manplot=manplot + opts(legend.position = "none")
                manplot=manplot + opts(title=title)
                manplot=manplot+opts(
                        panel.background=theme_blank(),
                        axis.text.x=theme_text(size=size.x.labels, colour="grey50"),
                        axis.text.y=theme_text(size=size.y.labels, colour="grey50"),
                        axis.ticks=theme_segment(colour=NA)
                )
                #manplot = manplot + opts(panel.grid.y.minor=theme_blank(),panel.grid.y.major=theme_blank())
                #manplot = manplot + opts(panel.grid.major=theme_blank())

                if (suggestiveline) manplot=manplot+geom_hline(yintercept=suggestiveline,colour="blue", alpha=I(1/3))
                if (genomewideline) manplot=manplot+geom_hline(yintercept=genomewideline,colour="red")
                manplot
        }       else {
                stop("Make sure your data frame contains columns CHR, BP, and P")
        }
}


qq = function(pvector, title=NULL, spartan=F) {
        # Thanks to Daniel Shriner at NHGRI for providing this code for creating expected and observed values
        o = -log10(sort(pvector,decreasing=F))
        e = -log10( 1:length(o)/length(o) )
        # you could use base graphics
        # plot(e,o,pch=19,cex=0.25, xlab=expression(Expected~~-log[10](italic(p))),
        # ylab=expression(Observed~~-log[10](italic(p))), xlim=c(0,max(e)), ylim=c(0,max(e)))
        # lines(e,e,col="red")
        #You'll need ggplot2 installed to do the rest
        qq=qplot(e,o, xlim=c(0,max(e)), ylim=c(0,max(o))) + stat_abline(intercept=0,slope=1, col="red")
        qq=qq+opts(title=title)
        qq=qq+scale_x_continuous(name=expression(Expected~~-log[10](italic(p))))
        qq=qq+scale_y_continuous(name=expression(Observed~~-log[10](italic(p))))
        if (spartan) plot=plot+opts(panel.background=theme_rect(col="grey50"), panel.grid.minor=theme_blank())
        qq
}
rgqqMan = function(infile="/tmp/rgManQQtempcWfFkc",chromcolumn=1, offsetcolumn=2, pvalscolumns=c(3),
title="rgManQQtest1",grey=0) {
rawd = read.table(infile,head=T,sep='\t')
dn = names(rawd)
cc = dn[chromcolumn]
oc = dn[offsetcolumn]
nams = c(cc,oc)
plen = length(rawd[,1])
doreorder=1
print(paste('###',plen,'values read from',infile,'read - now running plots',sep=' '))
if (plen > 0) {
  for (pvalscolumn in pvalscolumns) {
  if (pvalscolumn > 0)
     {
     cname = names(rawd)[pvalscolumn]
     mytitle = paste('p=',cname,', ',title,sep='')
     myfname = chartr(' ','_',cname)
     myqqplot = qq(rawd[,pvalscolumn],title=mytitle)
     ggsave(filename=paste(myfname,"qqplot.png",sep='_'),myqqplot,width=11,height=8,dpi=100)
     print(paste('## qqplot on',cname,'done'))
     if ((chromcolumn > 0) & (offsetcolumn > 0)) {
         if (doreorder) {
             rawd = rawd[do.call(order,rawd[nams]),]
             # mmmf - suggested by http://onertipaday.blogspot.com/2007/08/sortingordering-dataframe-according.html
             # in case not yet ordered
             doreorder = 0
             }
         print(paste('## manhattan on',cname,'starting',chromcolumn,offsetcolumn,pvalscolumn))
         mymanplot= manhattan(chrom=rawd[,chromcolumn],offset=rawd[,offsetcolumn],pvals=rawd[,pvalscolumn],title=mytitle,grey=grey)
         print(paste('## manhattan plot on',cname,'done'))
         ggsave(filename=paste(myfname,"manhattan.png",sep='_'),mymanplot,width=11,height=8,dpi=100)
         }
         else {
              print(paste('chrom column =',chromcolumn,'offset column = ',offsetcolumn,
              'so no Manhattan plot - supply both chromosome and offset as numerics for Manhattan plots if required'))
              }
     }
  else {
        print(paste('pvalue column =',pvalscolumn,'Cannot parse it so no plots possible'))
      }
  } # for pvalscolumn
 } else { print('## Problem - no values available to plot - was there really a chromosome and offset column?') }
}

rgqqMan()
# execute with defaults as substituted